Introduction
Since the information about FreeRTOS debugging with STM32CubeIDE is sparse and ST is not yet providing the task list view (that was part of the Atollic TrueStudio), here is, how you get it by installing a plugin from freescale and adding the approprite stuff to your code. I assume, you already have a project with FreeRTOS setup and running…
Adding the plugins
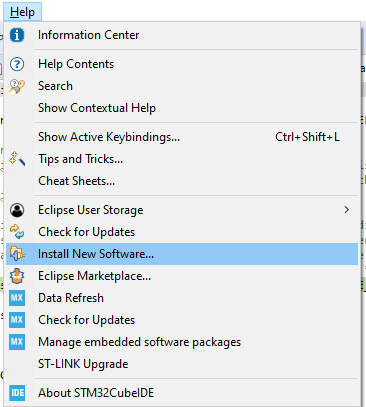
First start STM32CubeIDE and go to Help -> Install New Software…
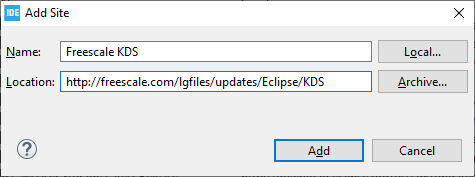
Then add an Update Site by clicking the „Manage“-Button. Here you need to add the update site from freescale. And yes, NXP/Freescales plugin works with STM’s CubeIDE 🙂
http://freescale.com/lgfiles/updates/Eclipse/KDS
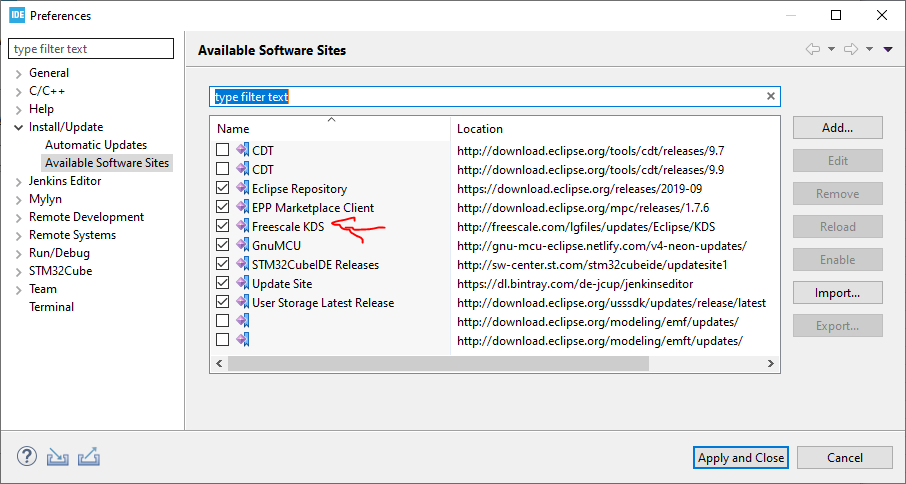
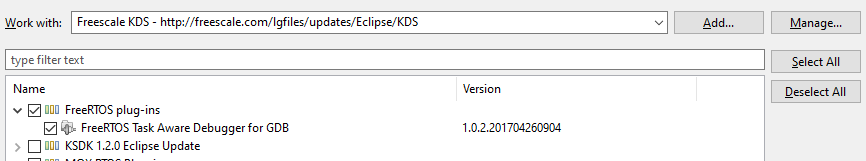
„Apply and Close“ and select the new site to „Work with“
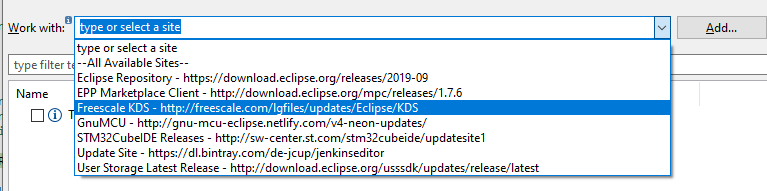
Select the FreeRTOS Task Aware Debugger for GDB.
And click Next… Follow the Wizard until complete and after installation, restart your STM32CubeIDE.
Configuring the FreeRTOS project
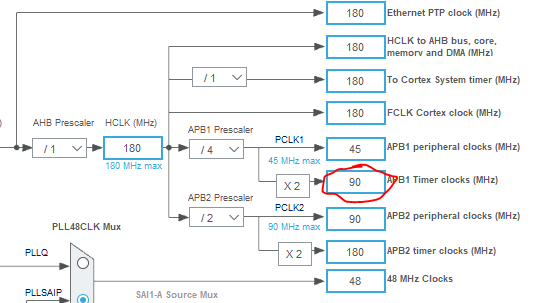
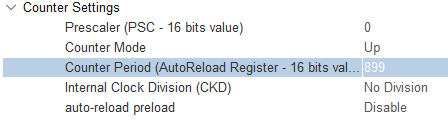
Now add a timer and configure a reasonably a high tick rate (e.g. I used TIM13 of my STM32F469, running with 180 MHz HCLK, 90 MHz APB1 Timer clock and a timer counter period of 899 -> 100 kHz resolution).
Enable the interrupt

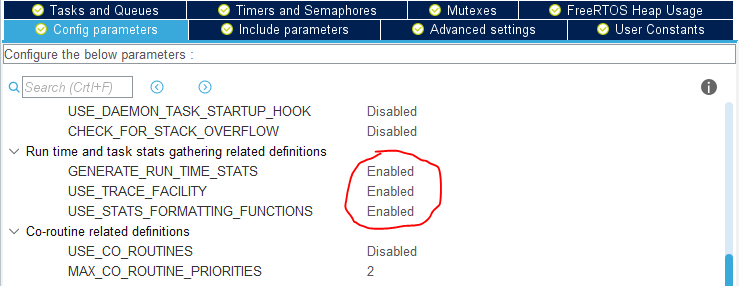
And in Middleware -> FreeRTOS, enable the run-time stats
If you like, you can also enable RECORD_STACK_HIGH_ADDRESS. Sometimes this is quite useful and avoids the little warning symbol in stack usage column of task list view.
Now regenerate your project…
Adjusting the code
Now it’s time to adjust your code for collecting the stats. Add a line for starting the timer in IT-mode by adding a function in some user code section in main.c.
volatile unsigned long ulHighFrequencyTimerTicks;

void configureTimerForRunTimeStats(void) {
  ulHighFrequencyTimerTicks = 0;
  HAL_TIM_Base_Start_IT(&htim13);
}

unsigned long getRunTimeCounterValue(void) {
  return ulHighFrequencyTimerTicks;
}
In stm32f4xx_it.c, add the following lines to the appropriate user sections
/* USER CODE BEGIN EV */
extern volatile unsigned long ulHighFrequencyTimerTicks;
/* USER CODE END EV */

[...]

void TIM8_UP_TIM13_IRQHandler(void)
{
  /* USER CODE BEGIN TIM8_UP_TIM13_IRQn 0 */
  ulHighFrequencyTimerTicks++;
  /* USER CODE END TIM8_UP_TIM13_IRQn 0 */
  HAL_TIM_IRQHandler(&htim13);
  /* USER CODE BEGIN TIM8_UP_TIM13_IRQn 1 */
  /* USER CODE END TIM8_UP_TIM13_IRQn 1 */
}
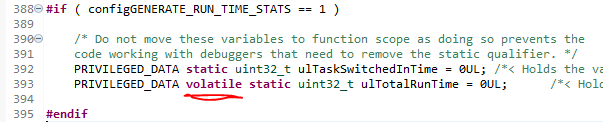
If you are compiling with optimization levels above -O0, you also need to fix a bug (it is one in my opinion) in freertos tasks.c.
There are two possibilities:
- Switch of optimizations for tasks.c by right clicking on the file in project browser and changing the compiler optimization to
-O0 - Change the line in tasks.c adding a volatile (see picture)
The problem with solution 2 is, that you need to do it after each STM32CubeMX code generation again. But there is a 3rd solution, that makes solution 2 persistend (until you update the MCU package).
Go to `%HOMEPATH%\STM32Cube\Repository\STM32Cube_FW_F4_V1.25.0\Middlewares\Third_Party\FreeRTOS\Source\` and edit the file like in solution 2, adding a volatile statement.
When you regenerate your project from CubeMX, it will include the correct line.
Profiling in action
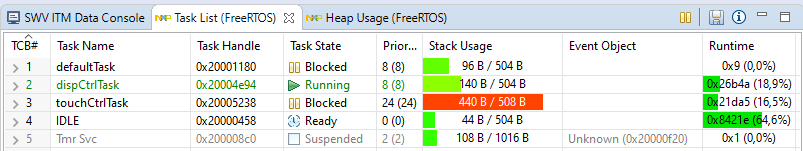
Now after you put everything in place, it is time to run your code. Start the project in debugging mode, make the FreeRTOS/Task List view visible and let it run for some seconds. Then hit the pause button. The task list will collect the information from your target (from GDB) and show it nicely:
If the Task List view complains about FreeRTOS not have being detected, restart STM32CubeIDE and it should show up again.
Edit: During my last weeks of uing this Eclipse plugin, I had some problems seeing all tasks in Task Analyzer. In fact, the FreeRTOS functions to print the run-time statistics show them, while the plugin doesn’t. Also the data seems to be currupted sometimes within the plugin. So I would suggest, to better use the FreeRTOS internal stuff: https://www.freertos.org/rtos-run-time-stats.html
Citations
The information was collected from these links:
2 Kommentare