
EMoleCAD – Wiring Diagrams From YAML, Drawn by a Mole
Electrical overview diagrams for German installations without a Windows-only CAD licence: a browser tool that turns YAML or a Node-RED-style editor into single-line and all-pole schematics, ready for the grid operator.
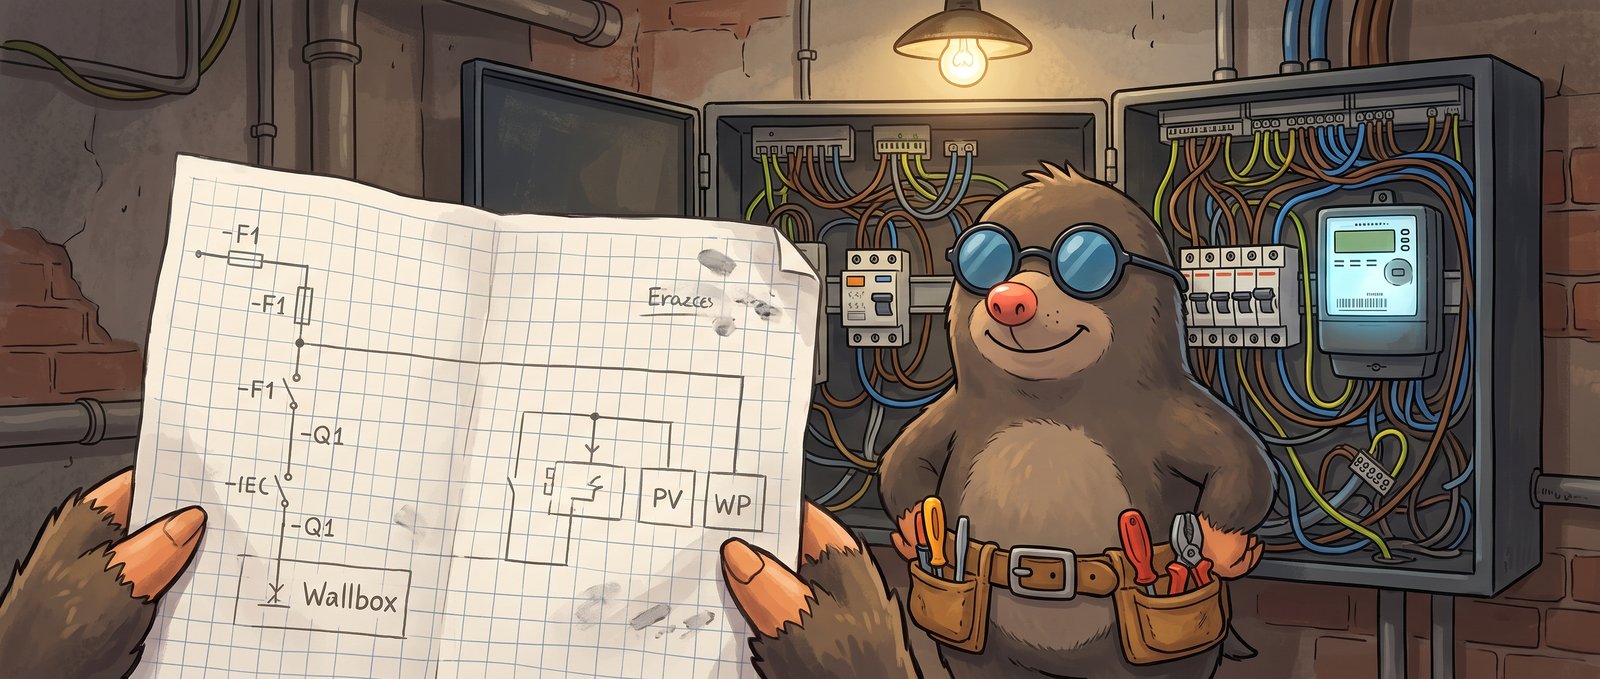
Every burrow has a fuse box, and every fuse box eventually needs a drawing. Mine got one the hard way: a wallbox, a heat pump, a PV inverter with a battery, a smart meter gateway and a §14a control box all want to be registered with the grid operator, and every one of those forms asks for the same thing – an Übersichtsschaltplan, the single-line overview diagram of the installation.
The professionals draw these in dedicated electrical CAD packages. They are good, they are Windows-only, and they are priced for companies that bill by the hour. I bill by the earthworm. Drawing the same thing in a generic diagram editor works, but every new circuit means pushing thirty boxes around, renumbering half of them, and hoping the table at the bottom still matches the picture.
So I did what moles do: I dug a new tunnel. The result is EMoleCAD, a browser tool that takes a structured description of an installation and draws the schematic for you.
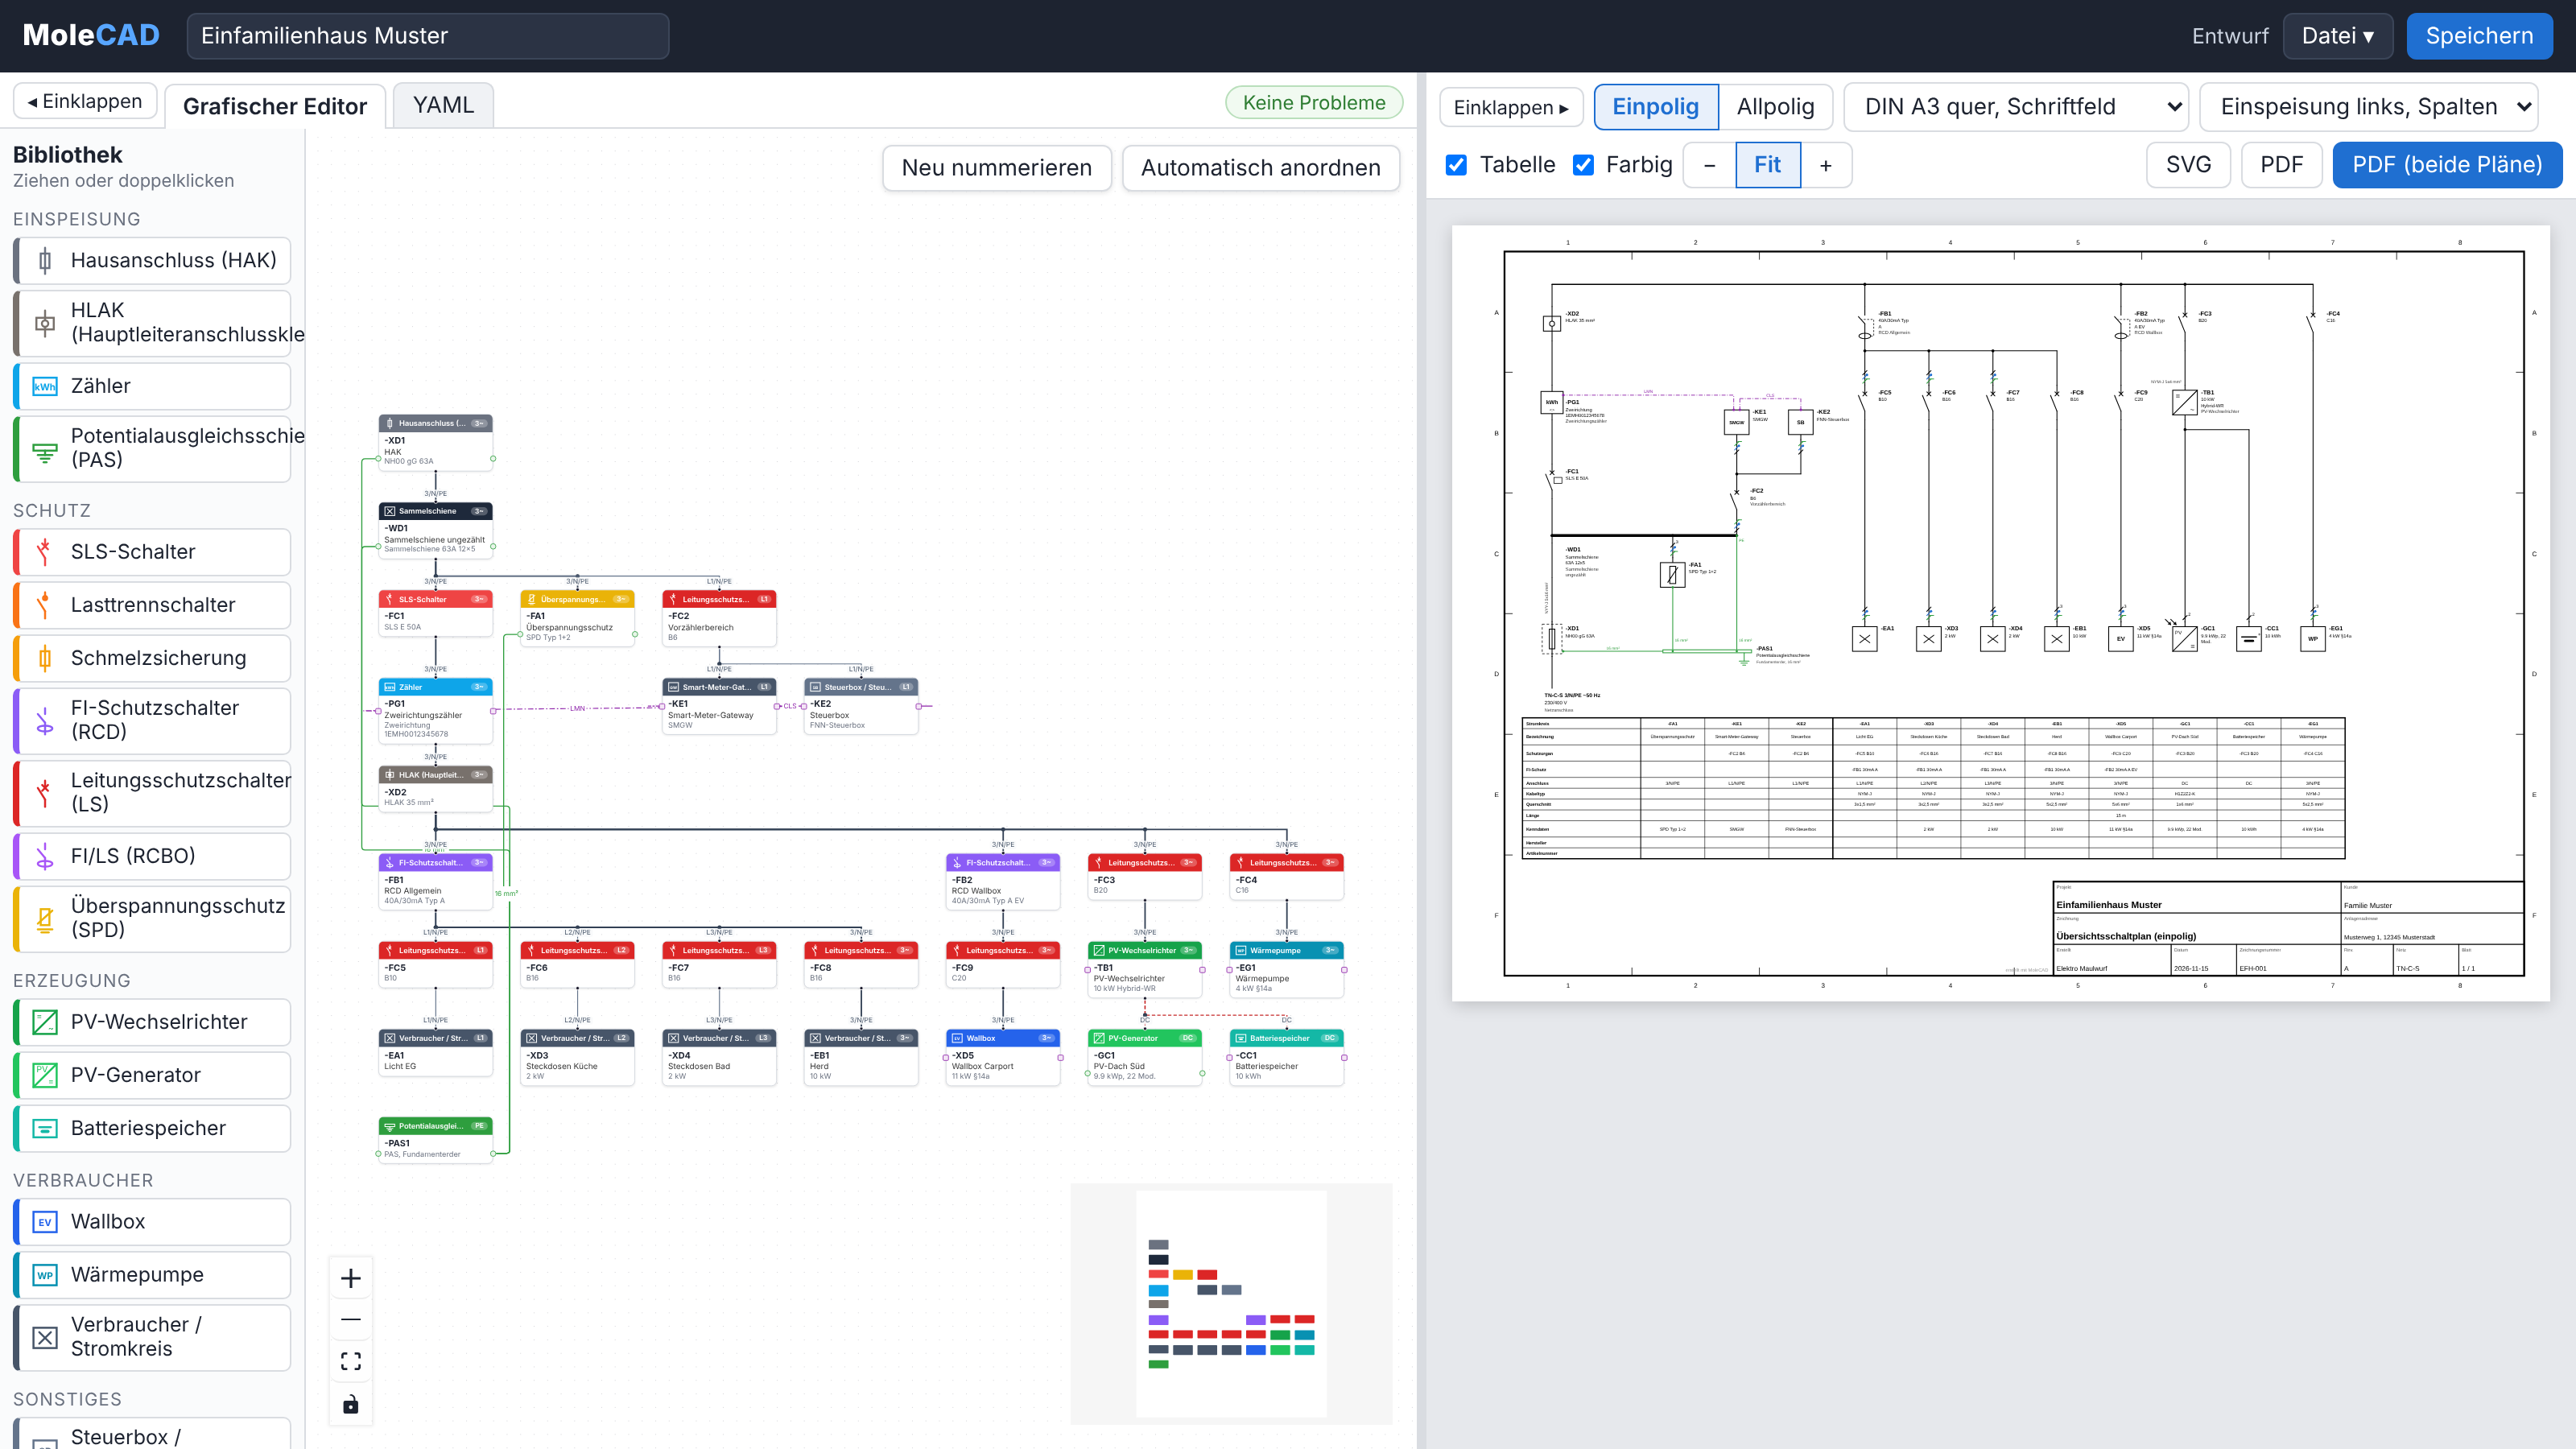
It runs at the78mole.github.io/EMoleCAD, and there is an offline single-file build (emolecad.html) you can download and open without any server. The source is MIT-licensed on GitHub at the78mole/EMoleCAD. Fair warning for surface-dwellers: the user interface is German, because the whole thing is aimed at the German grid and its paperwork.
The Stack at a Glance
| Layer | Choice | Why |
|---|---|---|
| UI | React 19 + Vite | Fast to build, static output for GitHub Pages |
| Graphical editor | React Flow (@xyflow/react) | Node-RED-style boxes and wires for free |
| Text editor | CodeMirror with YAML mode | Syntax highlighting, folding, good keyboard feel |
| Model | Plain TypeScript + yaml | One data model, two views on it |
| Schematic | Hand-written SVG generator | Full control over symbols and layout |
| Export | jsPDF + svg2pdf.js | Vector PDF straight from the SVG |
| Storage | File System Access API, localStorage | Save into the open file, draw.io style |
No backend. Nothing leaves the browser.
One Model, Two Views
The core idea is that the installation is a tree. Every component has an ID and a quelle (source) – the component directly upstream of it. The house connection box feeds a busbar, the busbar feeds the main switch, which feeds the meter, which feeds the distribution, which feeds an RCD, which feeds a circuit breaker, which feeds the kitchen sockets. Write that down and the drawing follows.
You can write it down in two ways, and both edit the same model:
- Graphical editor: drag building blocks from the library onto the canvas and wire the bottom port (outgoing) of one block to the top port (incoming) of the next. Double-clicking a library entry attaches the new block straight to the selected one.
- YAML: the same data as text. Changes apply as you type, and if you produce a syntax error the last valid state stays on screen instead of the drawing blowing up.
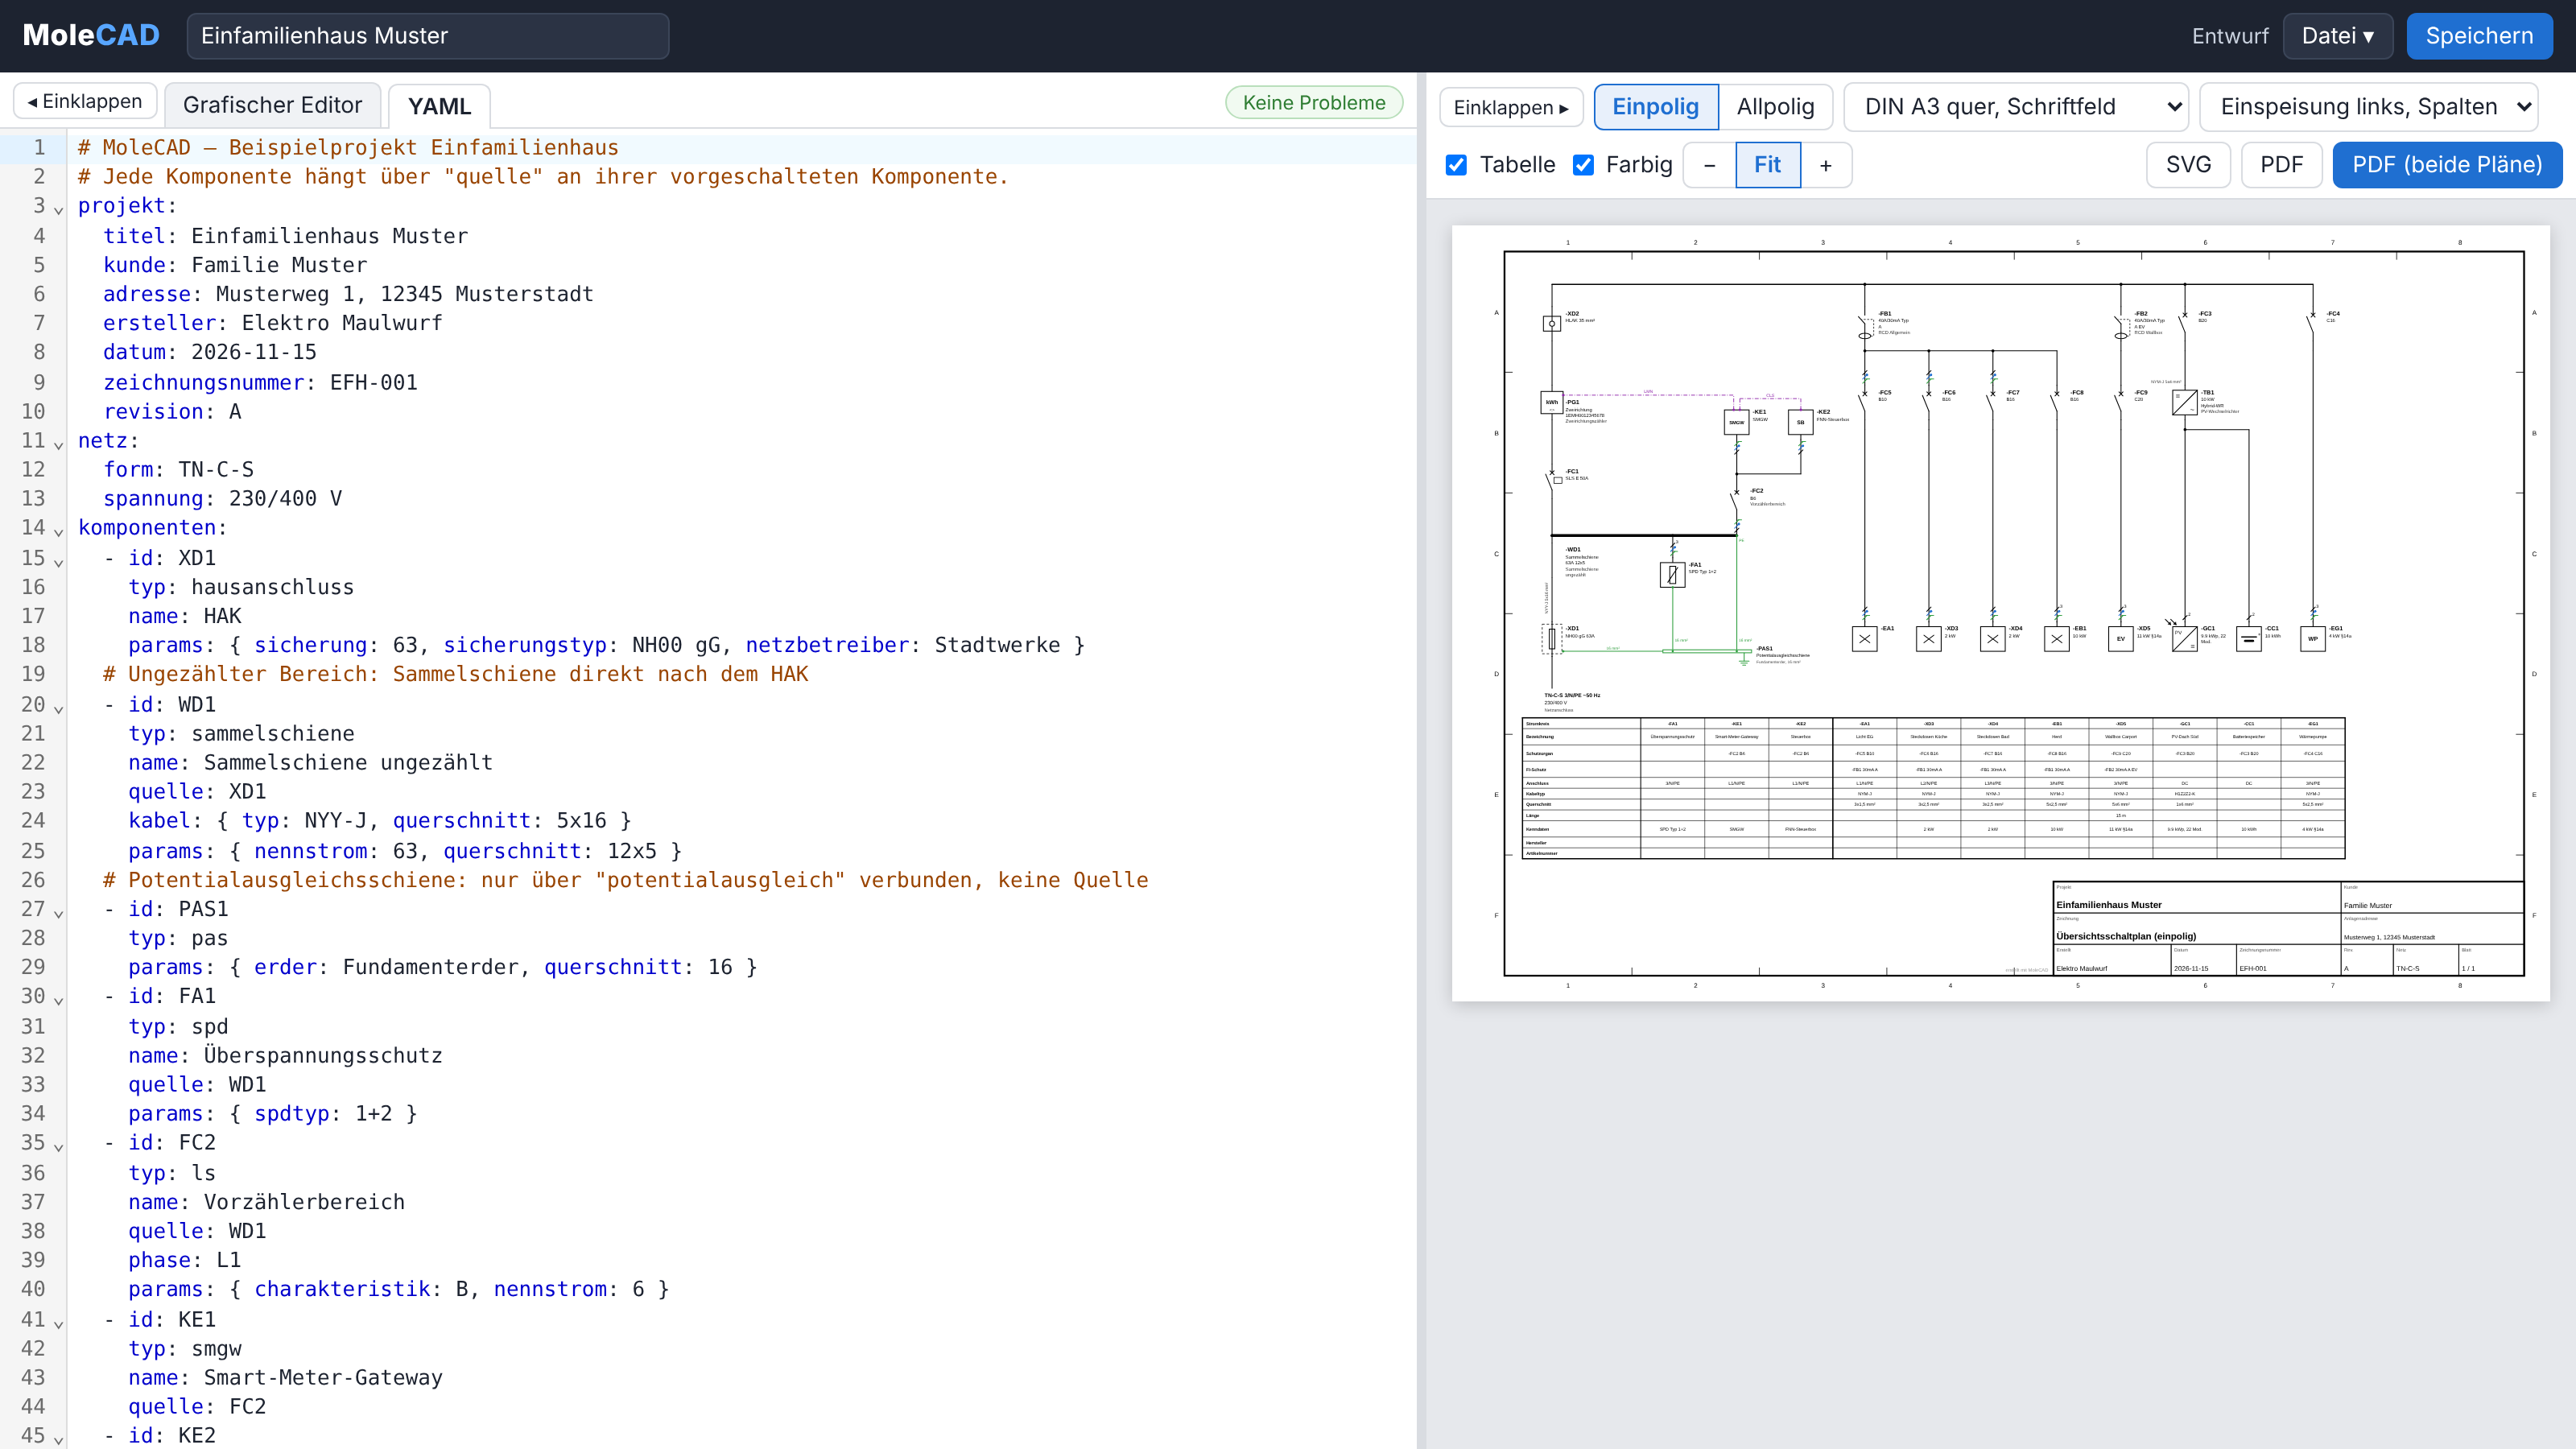
A minimal project looks like this:
projekt:
  titel: Einfamilienhaus Muster
  ersteller: Elektro Maulwurf
  zeichnungsnummer: EFH-001
netz:
  form: TN-C-S
  spannung: 230/400 V
komponenten:
  - id: XD1
    typ: hausanschluss
    params: { sicherung: 63, sicherungstyp: NH00 gG }
  - id: FB1
    typ: rcd
    quelle: XD1
    params: { nennstrom: 40, fehlerstrom: 30, rcdtyp: A }
  - id: FC5
    typ: ls
    quelle: FB1
    phase: L1
    params: { charakteristik: B, nennstrom: 16 }
  - id: EA1
    typ: verbraucher
    name: Licht EG
    quelle: FC5
    params: { verwendung: Beleuchtung }
    kabel: { typ: NYM-J, querschnitt: "3x1,5", laenge: 12 }
The projekt block fills the title block of the drawing sheet. Components can also carry produkt (manufacturer and part number), which ends up in the circuit table. If you leave out pole, the tool picks the default for the type and automatically goes single-phase underneath a single-phase feed.
Single-Line and All-Pole From the Same Data
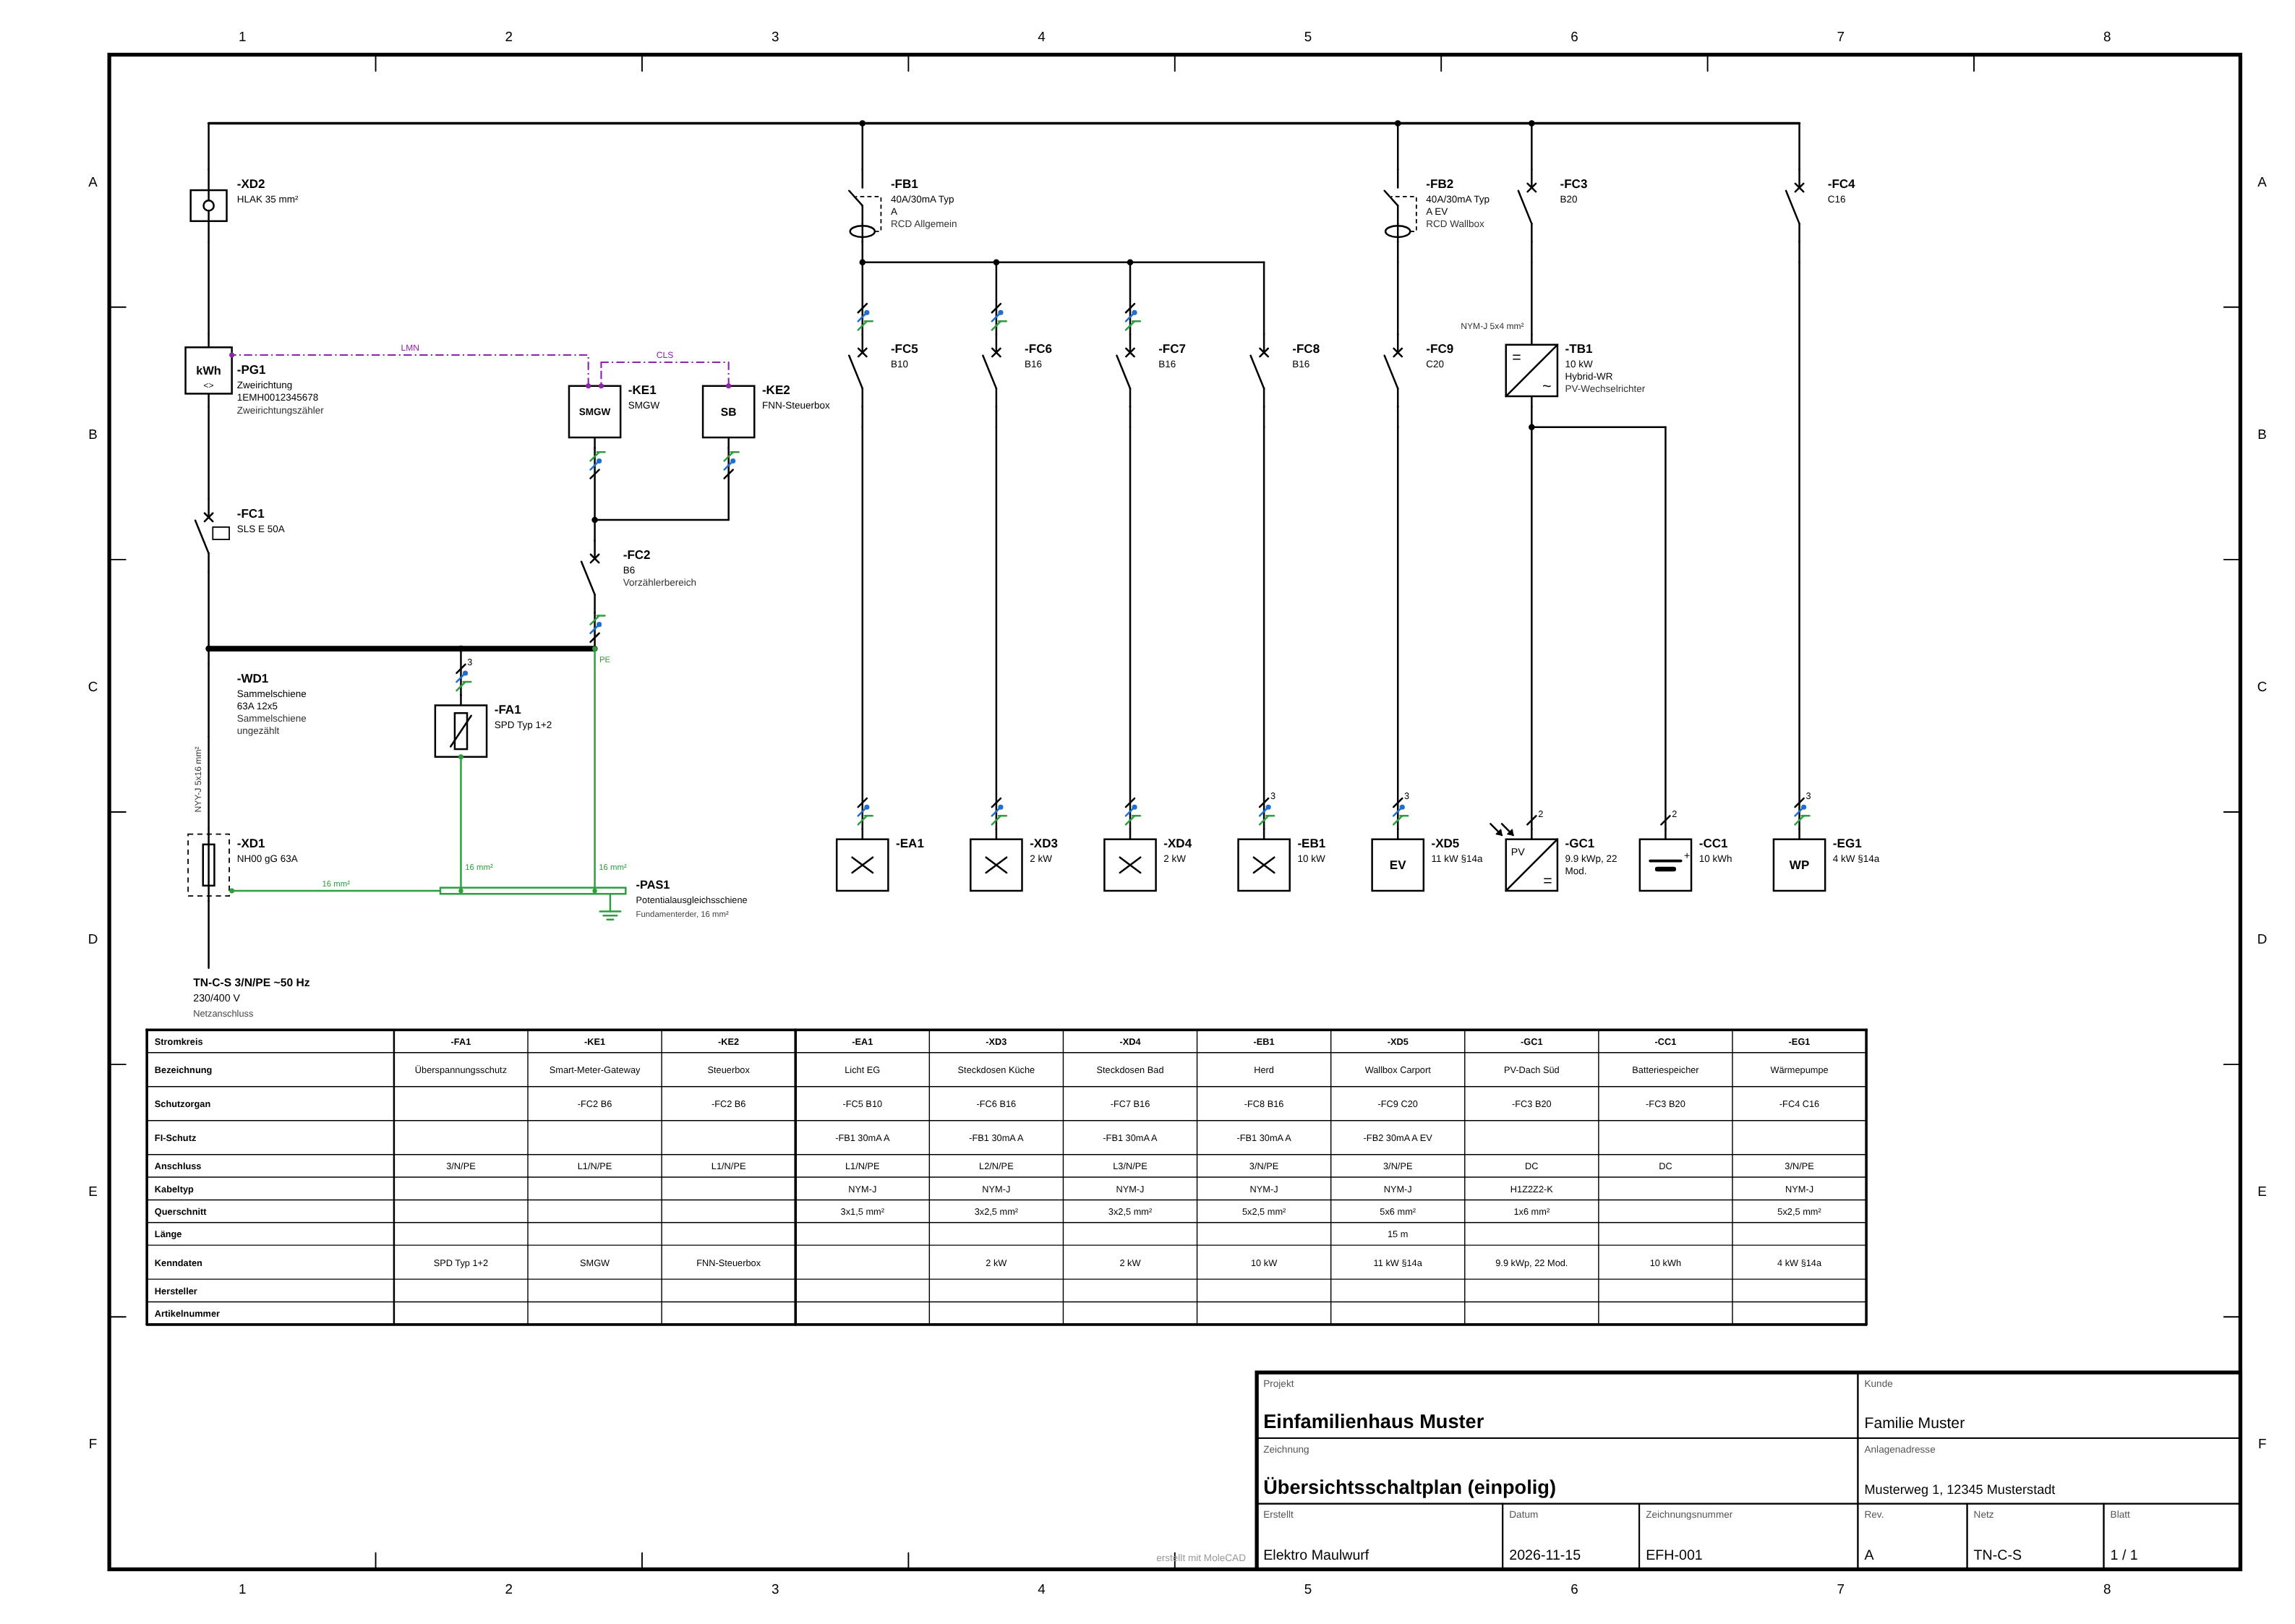
The plan view on the right renders the model in two flavours. The single-line diagram (einpolig) is what grid operators usually want: the feed-in on the left, one column per outgoing circuit, and a circuit table underneath listing protection device, RCD, connection, cable type, cross-section, length and ratings for every circuit.
Flip the switch to all-pole (allpolig) and the same model becomes a full circuit diagram with every conductor drawn separately and colour-coded: L1 brown, L2 black, L3 grey, N blue, PE green, and red/blue for DC on the PV and battery side.
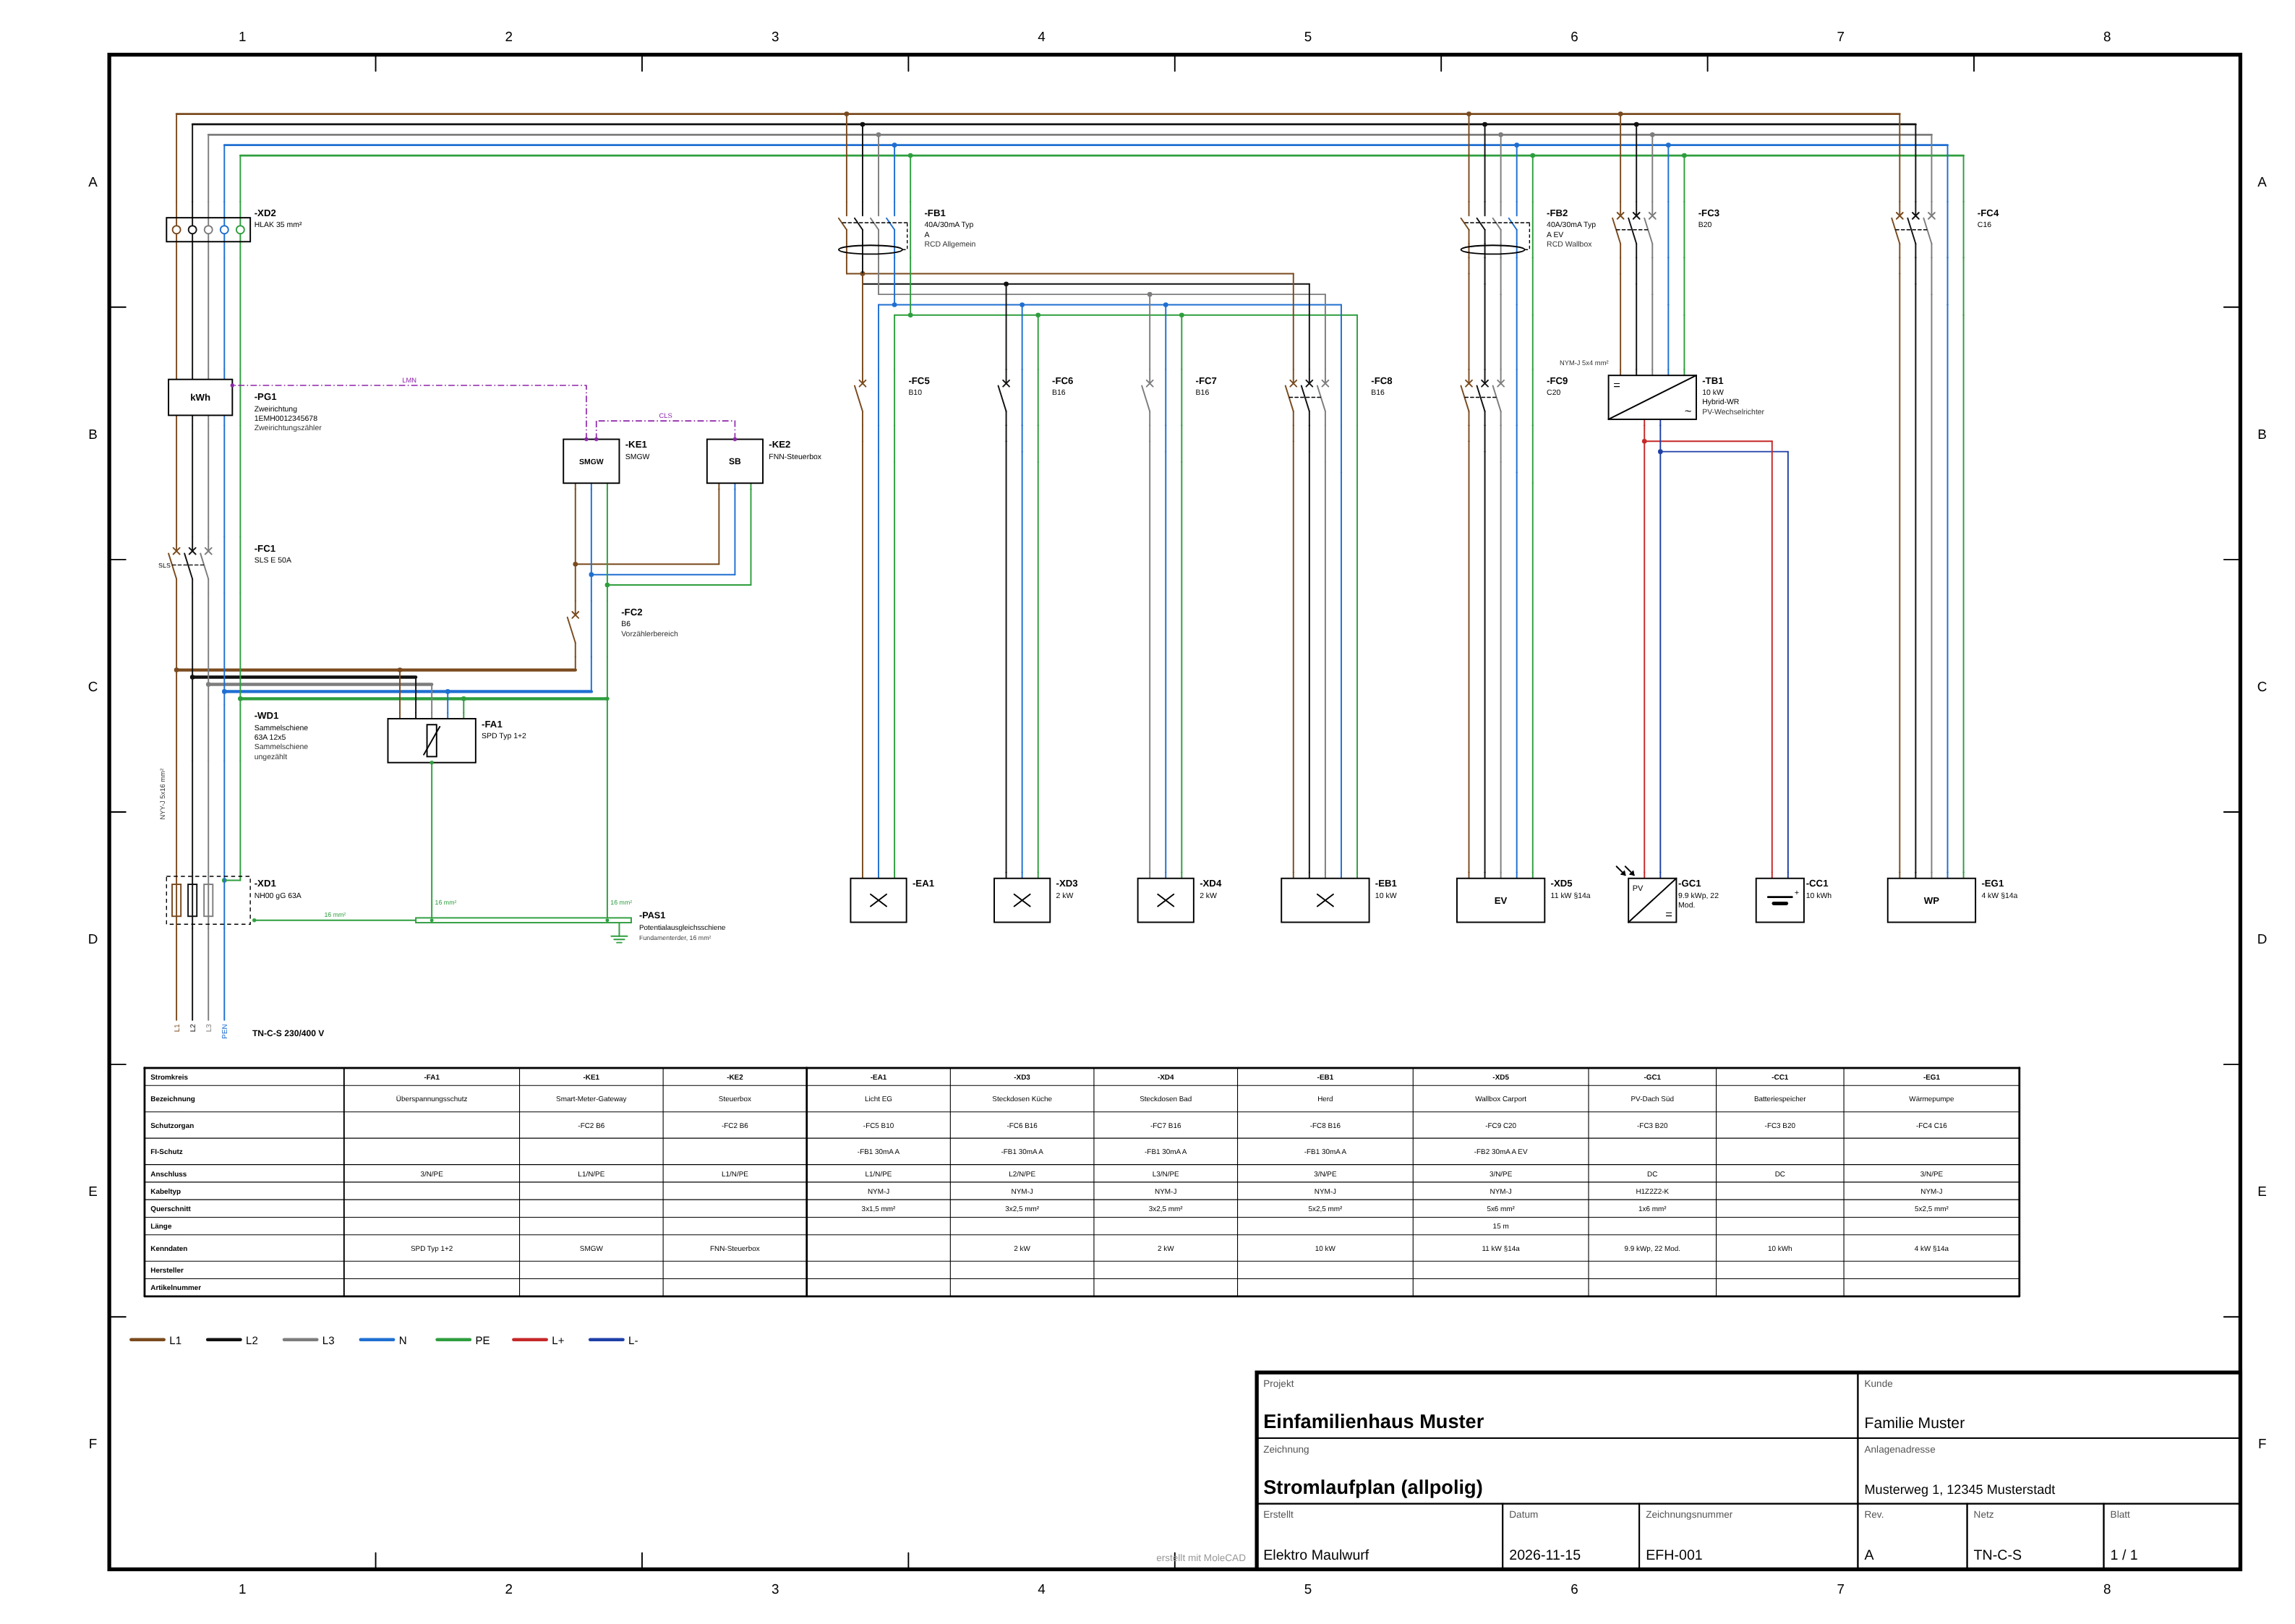
There are sheet templates for DIN A3 and A4 landscape with a full title block, compact variants, and a frameless version for the screen. Export goes to SVG, PDF, or a single PDF with both plans – which is exactly the attachment the grid operator's portal asks for.
The Bits That Make It an Installer's Tool
Drawing boxes is easy. What took the digging was teaching the tool how a German meter cabinet is actually built.
Device designations by the book
Every component gets its letter code according to DIN EN IEC 81346-2:2019: FC for circuit breakers and fuses, FB for RCDs, FA for surge protection, PG for the meter, QB for disconnectors, TB for the inverter, KE for the smart meter gateway and control box. Consumers get their code from their purpose – XD for sockets, EA for lighting, EB for heating and cookers, MA for motors. Conductor symbols in the single-line plan follow IEC 60617.
Renumbering that respects your fixed IDs
Add a circuit in the middle and the numbering is off. Neu nummerieren (renumber) walks the editor row by row, top to bottom, left to right, and hands out FC1, FC2, … per letter code. Sources and data links are renamed along with it. Components marked with ID festschreiben (fest: true in YAML, shown with a 🔒 in the editor) keep their ID, and that ID is reserved – nobody else gets it.
The unmetered area
The part in front of the meter is where it gets interesting. Components hanging off the house connection or the feed-in chain – surge protection, a 6 A breaker for the smart meter gateway and the control box – are drawn as parallel taps next to the feed-in instead of as regular outgoing circuits:
  - { id: WD1, typ: sammelschiene, quelle: XD1 }
  - { id: FA1, typ: spd,   quelle: WD1 }
  - { id: FC1, typ: sls,   quelle: WD1 }   # on to meter PG1, then main terminal XD2
  - { id: FC2, typ: ls,    quelle: WD1, phase: L1, params: { charakteristik: B, nennstrom: 6 } }
  - { id: KE1, typ: smgw,      quelle: FC2 }
  - { id: KE2, typ: steuerbox, quelle: FC2 }
The feed-in chain runs busbar → selective main circuit breaker → meter → main conductor terminal; the first real branch afterwards becomes the main busbar of the distribution.
Data links and equipotential bonding
Since §14a EnWG, a meter cabinet also carries data. Communication links live separately in datenverbindungen and are drawn as dash-dotted violet lines – LMN between gateway and meter, CLS between control box and gateway, Modbus to the inverter, and so on. In the editor, communication-capable blocks have violet ports on their sides.
datenverbindungen:
  - { von: KE1, nach: PG1, art: LMN }
  - { von: KE2, nach: KE1, art: CLS }
potentialausgleich:
  - { von: PAS1, nach: XD1, querschnitt: 16 }
  - { von: PAS1, nach: FA1, querschnitt: 16 }
The equipotential bonding bar (typ: pas) has no source at all. Its connections are listed under potentialausgleich and drawn in green with their cross-section. At the surge arrester the bonding line replaces the plain earth symbol.
Checks while you type
The badge in the top right says Keine Probleme (no problems) as long as the model is sane. Otherwise it complains about missing sources, loops, duplicate IDs, phase conflicts – and about unbalanced load above 4.6 kVA between the phases from single-phase consumers, which is the classic limit the grid operators care about.
Saving Like a Desktop App
The Datei menu has Open, Save, Save as and Recent files, with the usual Ctrl+O / Ctrl+S / Ctrl+Shift+S. In Chrome, Edge and Opera the tool writes straight back into the file you opened, using the File System Access API – the same trick draw.io uses. The file handle survives a page reload. Firefox and Safari don't support that API, so there Save falls back to downloading the YAML. Unsaved changes get a ● next to the file name, closing the tab warns you, and a draft always sits in localStorage in case the browser crashes.
The storage layer is pluggable: each location implements oeffnen, laden, speichern and speichernUnter. Local files are done; GitHub, Nextcloud via WebDAV and Google Drive are the next tunnels to dig.
Try It
git clone https://github.com/the78mole/EMoleCAD.git
cd EMoleCAD
npm install
npm run dev          # http://localhost:5173
npm run build:single # one self-contained HTML file in dist-single/
Or just open the hosted version, which starts with the example house shown above.
One serious note before the mole goes back underground: EMoleCAD is a drawing aid. The plans it produces don't replace planning and testing by a qualified electrician, and they don't replace talking to your grid operator.
What's Next
The shopping list is long: more storage backends, multi-sheet plans for bigger installations with sub-distributions, and more symbols for whatever the next §14a device turns out to be. If you draw meter cabinets for a living and something in the plan looks wrong to you, open an issue – I'd rather be corrected by a surface-dweller with a VDE certificate than by an inspector with a red pen.